
While Inkscape is a great vector editor, its startup performance on Windows is terrible, often taking 5 seconds or more to open an empty window on my computer. Investigating the application startup seemed like a fun project to get familiar with Event Tracing for Windows (ETW) and related tools. I think I found some interesting results, so I decided to write this report.
If you are not familiar with ETW, it is a tracing system and sampling profiler built directly into Windows. To use ETW you need to install the Windows Performance Toolkit, which contains tools to record and analyze traces, e.g. the Windows Performance Analyzer (WPA), which is a graphical tool used to view the traces. I am also using UIforETW, which makes recording ETW traces super easy (barely an inconvenience) and has a nicer default profile for WPA. It ships with a Windows Performance Toolkit installer, therefore UIforETW was the only thing I had to download in this regard. UIforETW was created by Bruce Dawson and you can find a ton of information about ETW on his blog as well as lots of interesting articles where he uses ETW to find crazy bugs in Windows and other software.
Before getting started I had to compile Inkscape and glib with debug symbols enabled. As usual when building bigger C++ projects, this required a lot of bandwidth, disk space and patience (especially since Inkscape requires MSYS2). Luckily, everything is well documented on the Inkscape wiki. Still, there were some gotchas with glib and building PDB files (if you want to reproduce this, the details are in the appendix).
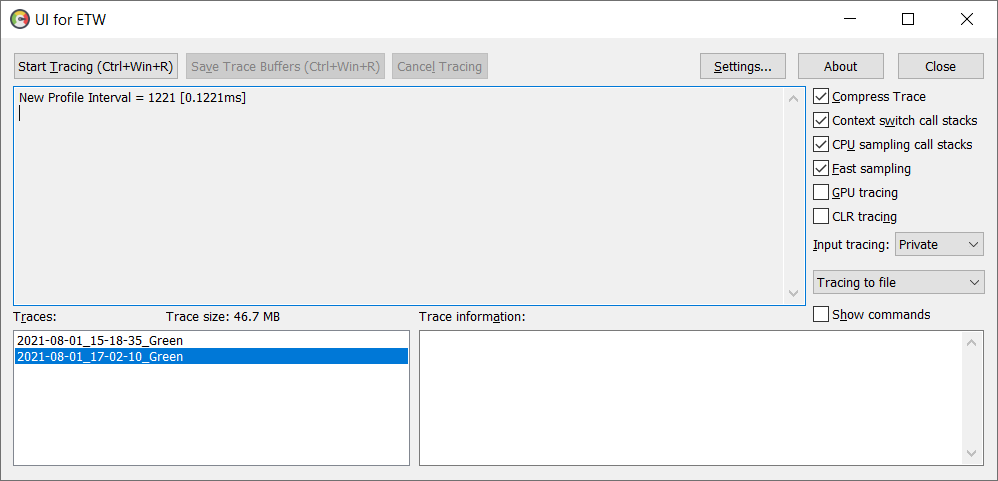
The screenshot below shows the main window of UIforETW. To create a trace, I just pressed Start Tracing and launched the Inkscape executable, that’s it. ETW always records all programs running on the machine. I also activated the checkbox for fast sampling to get more accurate data. The traces show up in the bottom left and if you click on them, they are opened in WPA.
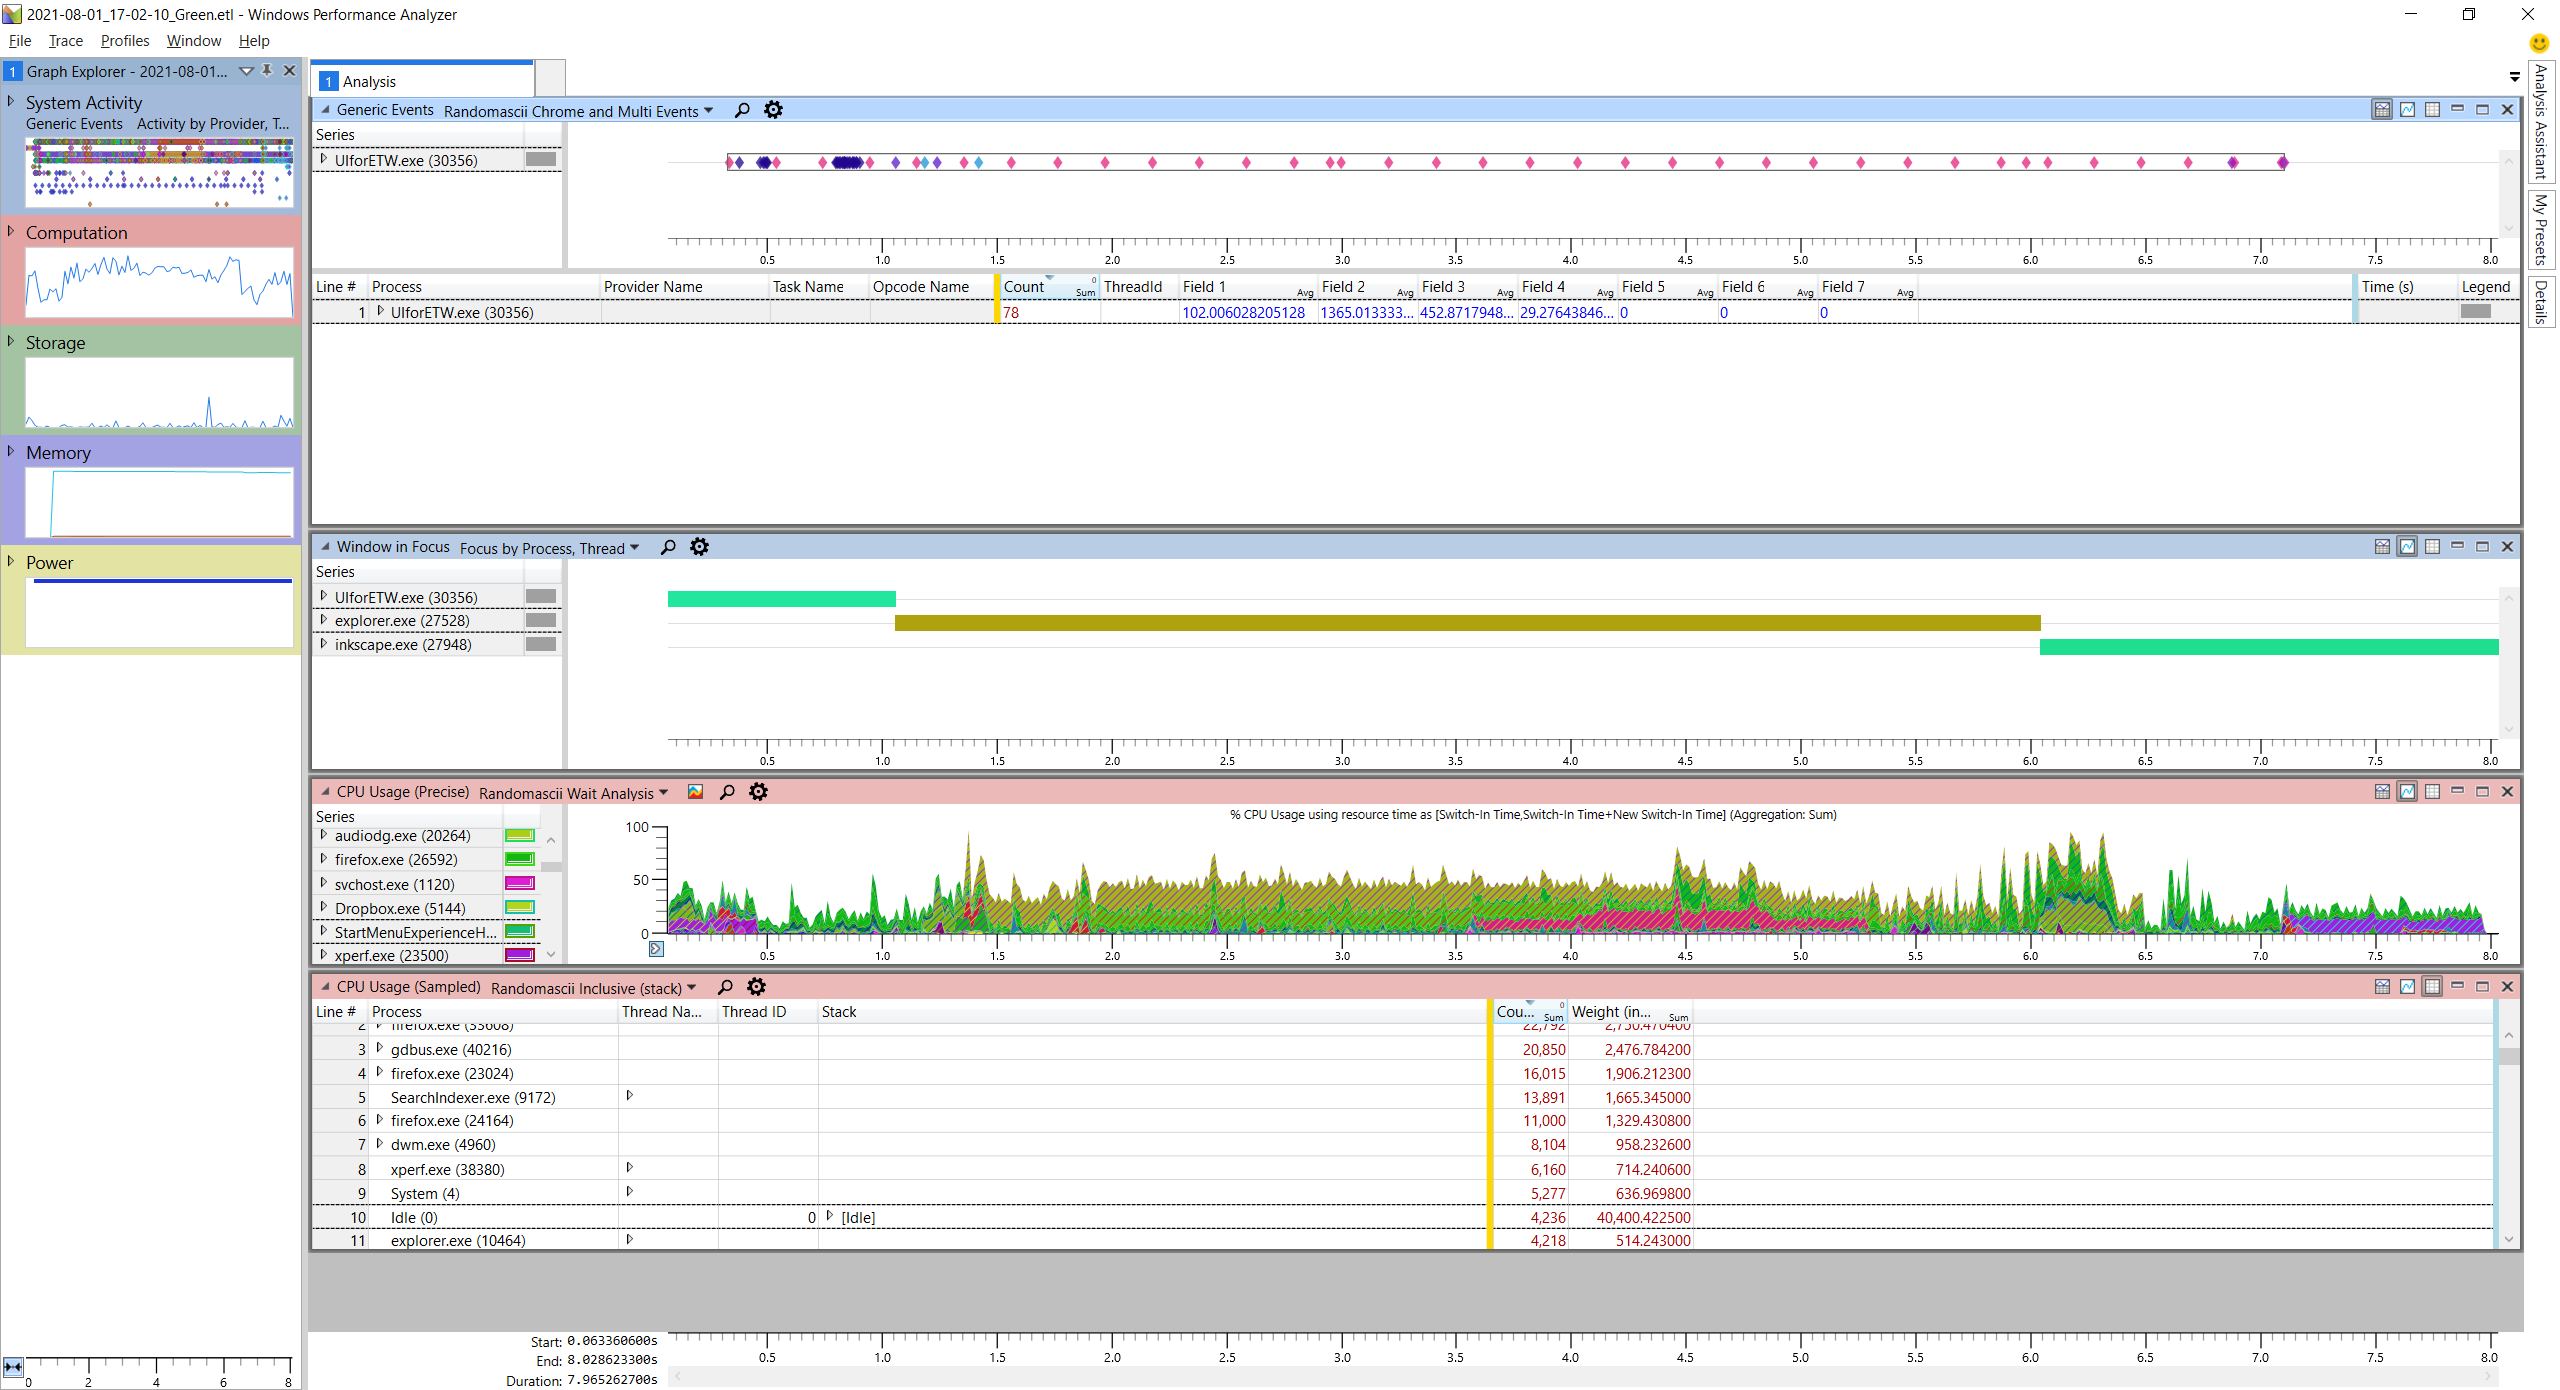
The next screenshot shows what WPA looks like. Below I will show screenshots of the relevant sections only. This is my first time using ETW, so please take everything with a grain of salt.
Initial analysis
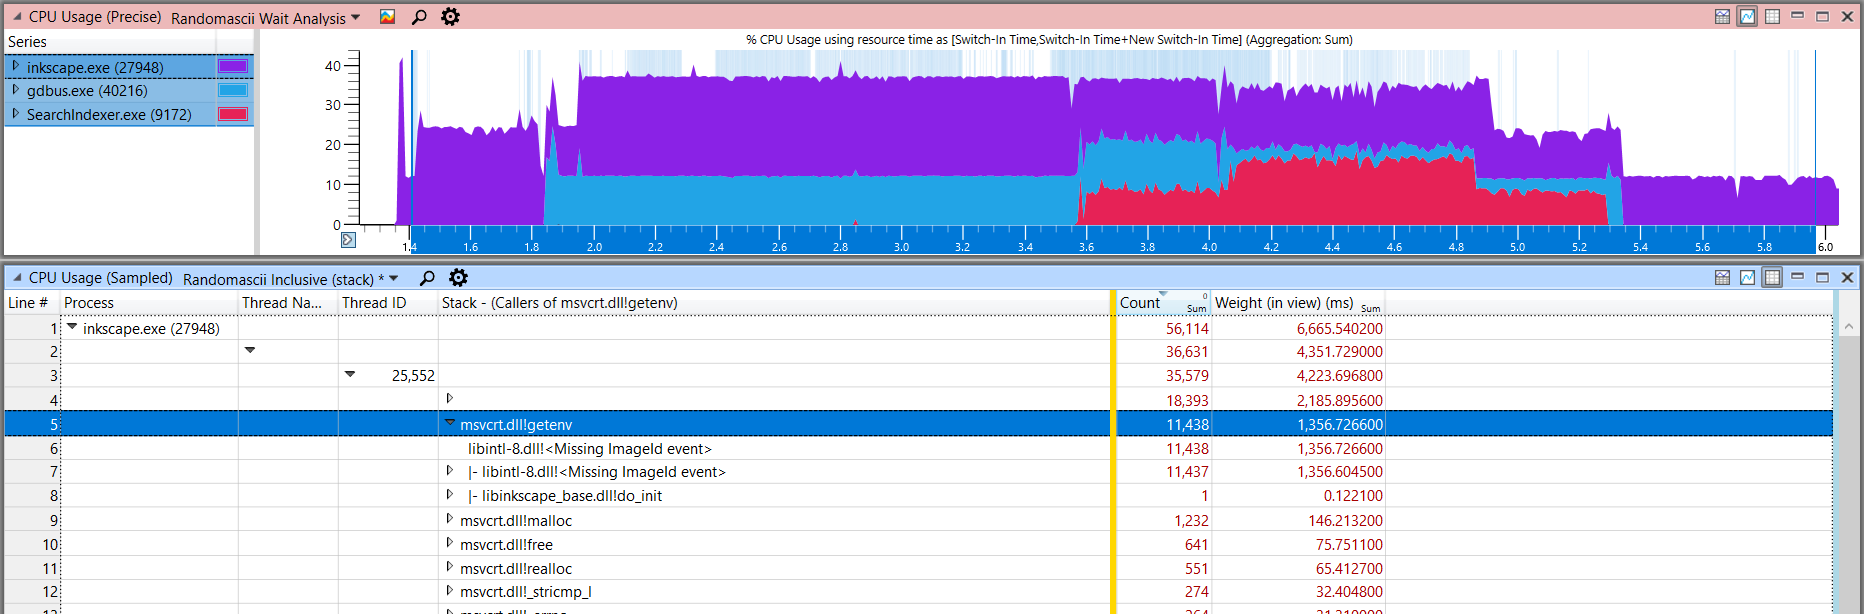
First, I filtered the CPU Usage windows to contain only three processes, inkscape.exe, gdbus.exe, which is a child process of Inkscape, and SearchIndexer.exe, which is an indexing service from Windows, but its sudden burst of activity seems to be triggered by launching Inkscape. I have not looked into SearchIndexer.exe yet, and will focus only on the Inkscape process for now.
The topmost window shows a bunch of events including user input. In the next screenshot, I have marked the mouse down events from double clicking on the Inkscape executable. These are followed by a bunch of CPU activity while Inkscape launches. Finally, the second window shows the focus switching from Windows Explorer to the just created Inkscape window.
The selected region shows that the startup time was 4.8 seconds in this case. Using a release binary, a startup takes about 4 seconds (manually timed). So there might be a little bit of overhead, but it is not too bad. Interestingly, on a Fedora VM running on the same machine, Inkscape starts in slightly under 3 seconds, and in general the startup time under Windows feels a lot worse than under Linux. Anyway, for the rest of the analysis I will zoom in on the selected region, which also filters out any samples outside of this region.

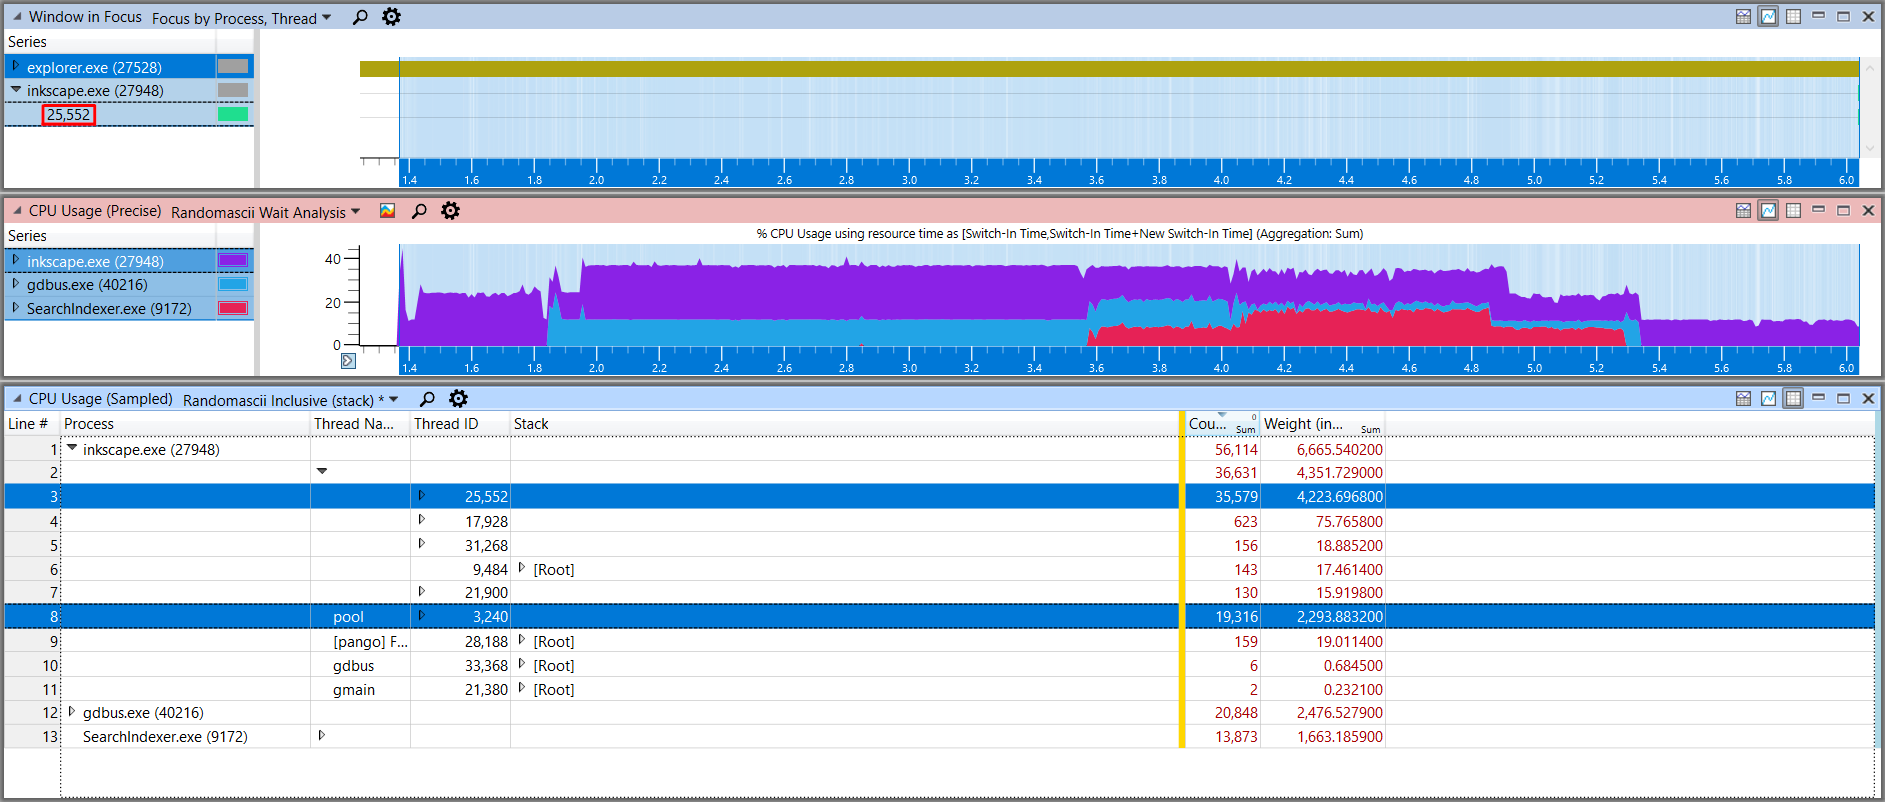
The CPU Usage table lets you analyze the data from the sampling profiler. It shows the CPU usage grouped by process, thread and call stack (columns on the left of the yellow bar). The count column shows the number of samples covered by that row, e.g. for the first row the count indicates that 56114 samples were collected for the inkscape.exe process (all threads combined). The weight column shows approximate CPU time in milliseconds and is roughly proportional to the sample count (as far as I understand this is based on the sample timestamps and the samples might not be perfectly spaced and therefore have slightly varying weight). Both of these columns are inclusive in this view.
There are two threads in the Inkscape process that use a significant amount of CPU time, an unnamed one, which is actually the main thread, and a pool thread.
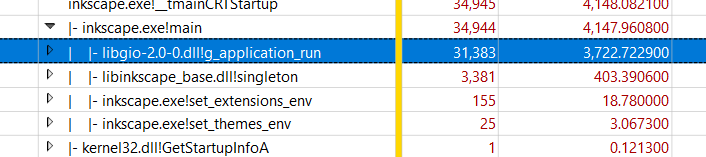
At first, I was a little confused by the stack trace view, so let me explain it. In the screenshot below, you can see the stack traces for the main thread. If the cell in the Stack column does not contain a “-” then the row is the only child of the parent row (the row directly above), but it is not indented to save space. If the cell does contain a “-” then the row is one of multiple children of the parent row (in this case you need to follow the tree to find the parent row).
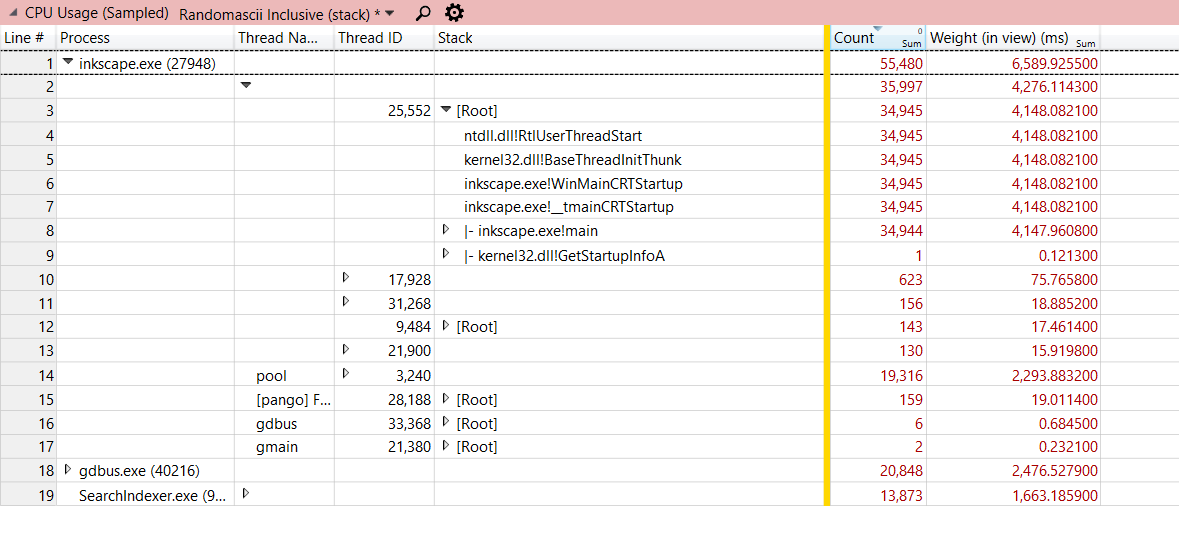
Exactly one sample (line 9) had a call stack like this (this stack grows upwards, while the tree grows downwards):
<some other functions>
kernel32.dll!GetStartupInfoA
inkscape.exe!__tmainCRTStartup
inkscape.exe!WinMainCRTStartup
kernel32.dll!BaseThreadInitThunk
ntdll.dll!RtlUserThreadStart
[Root]
And all other samples on the main thread had a call stack like this (as indicated by line 8 and above):
<some other functions>
inkscape.exe!main
inkscape.exe!__tmainCRTStartup
inkscape.exe!WinMainCRTStartup
kernel32.dll!BaseThreadInitThunk
ntdll.dll!RtlUserThreadStart
[Root]
I hope this makes things clear. The count and weight can be used to analyze where most of the CPU time was spent.
If there was a significant bottleneck, all the samples would be concentrated on a single call stack. Unfortunately, as you can see in the next screenshot, sometimes the numbers split. Here, the majority of the samples inside main were also inside g_application_run, but around 10% were in singleton instead, so still a significant fraction. Accordingly, there are multiple branches of the tree to explore and at some point, if the numbers keep splitting, the impact of any finding is negligible. For example, the set_extensions_env and set_themes_env functions can be ignored, because they only account for 21 milliseconds of CPU time.
Okay, after expanding this tree for a while, I found something very suspicious! In the next screenshot, you can see that _loadPaletteFile (one row above the highlighted one) accounts for 659 ms. But 607 ms (92%) are spent inside g_dpgettext2, which is a function that looks up the translation of a string for internationalization. What is going on here?!
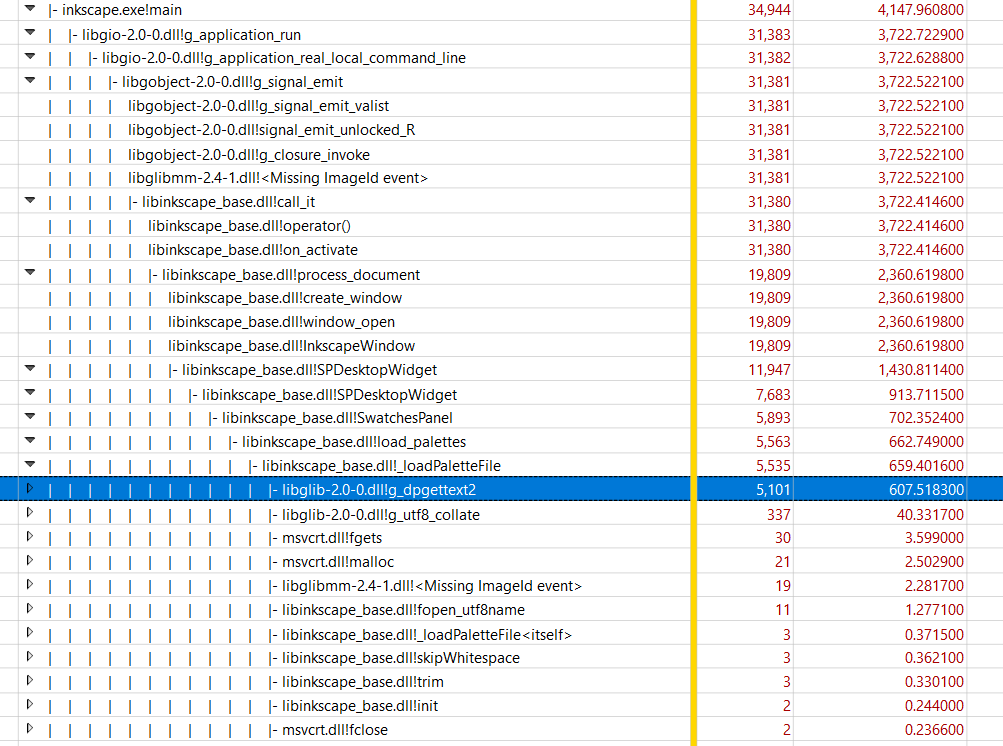
The first question is: Why does loading a palette file involve looking up translations?
Looking at the documentation for palettes and the source code for _loadPaletteFile shows that palettes use the GIMP format, which is essentially one color per line with the following format <R> <G> <B> <Name>. Furthermore, palettes are internationalized and the color names can be translated. Therefore, the loading function has to look up the translations (which is done here).
Okay, the second question is: Why is looking up translations so slow?
Expanding the call stack tree further shows that g_dpgettext2 calls into libintl-8.dll (for which I do not have symbols / debug info, which is shown as <Missing ImageId event>), which eventually calls msvcrt.dll!getenv.
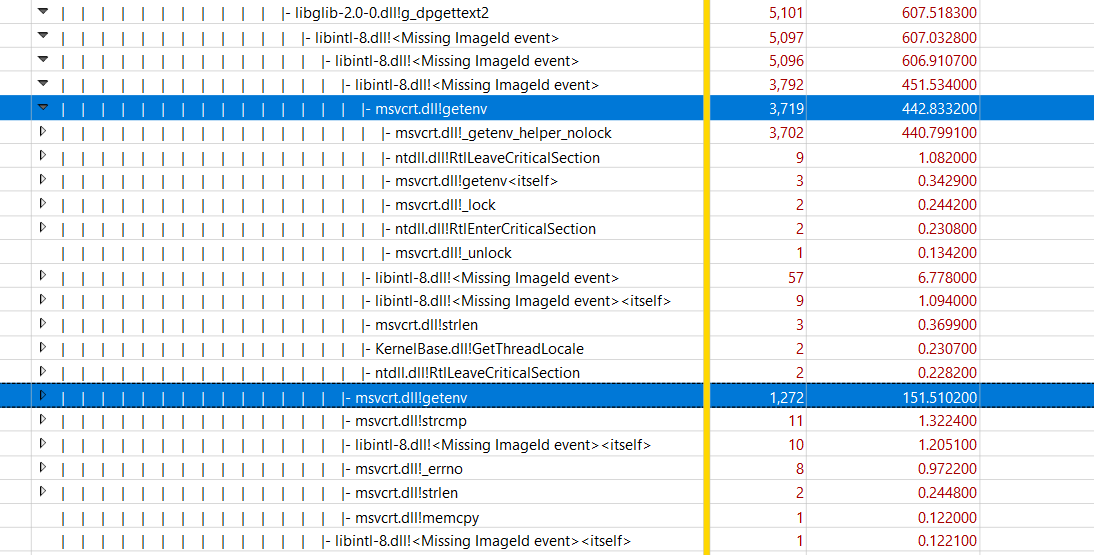
The call stack then ends with msvcrt.dll!_getenv_helper_nolock. getenv seems to acquire a lock and then call this helper function. The fact that all the samples are in the helper function indicates that this is not a lock contention issue, which is also what I would expect, as all the calls are from the same thread.
Before continuing, here’s an ETW magic trick. Right clicking on getenv and selecting View Callers – By Module shows all possible call stacks for getenv, not just the ones in _loadPaletteFile.
Apparently, in total over 1.3 seconds are spent inside getenv! And practically all the calls come from libintl-8.dll.
However, what this table does not show is whether getenv is slow or if it is just called a lot or even both. It could also be that only some calls to getenv are slow and others are fast. But before coming back to this, I wanted to know why looking up a translation involves getenv at all.
To figure this out, let’s dig into the code. As mentioned before, _loadPaletteFile calls g_dpgettext2, which is part of glib and shown below.
The string to be translated is passed as msgid and is often just called the message. Commonly, the message is just a string literal with the English text embedded in the code, but in this case it is the color name as loaded from the file. Inkscape also passes the string “Palette” as message context to distinguish color names from other translatable strings.
In the binary format for translations (MO files), the message context and message ID are concatenated using an ASCII End Of Transmission character ('04') as a separator and g_dpgettext2 performs this encoding.
const gchar *
g_dpgettext2 (const gchar *domain,
              const gchar *msgctxt,
              const gchar *msgid)
{
    size_t msgctxt_len = strlen (msgctxt) + 1;
    size_t msgid_len = strlen (msgid) + 1;
    const char *translation;
    char* msg_ctxt_id;

    msg_ctxt_id = g_alloca (msgctxt_len + msgid_len);

    memcpy (msg_ctxt_id, msgctxt, msgctxt_len - 1);
    msg_ctxt_id[msgctxt_len - 1] = '04';
    memcpy (msg_ctxt_id + msgctxt_len, msgid, msgid_len);

    translation = g_dgettext (domain, msg_ctxt_id);

    if (translation == msg_ctxt_id) {
        /* try the old way of doing message contexts, too */
        msg_ctxt_id[msgctxt_len - 1] = '|';
        translation = g_dgettext (domain, msg_ctxt_id);

        if (translation == msg_ctxt_id) {
            return msgid;
        }
    }

    return translation;
}
However, if a translation is not found, it tries “the old way of doing message contexts”, which means using a pipe as a separator. This means that everything that follows is done twice (for messages that are not found, but this includes most of the color names as will be discussed later).
g_dpgettext2 then calls g_dgettext, which is a thin wrapper around dgettext provided by libintl-8.dll. After Inkscape and glib, this is the third project involved. By the way, why is it so complicated to look up a translation?
Now it gets a little confusing, because dgettext seems to be provided by both libc and the gettext project. It is also defined in two headers libintl.h and gettext.h. Anyway, after a bit of digging through more wrapper functions and macros, deep in a function called dcigettext, I found a call to getenv:
const char *logfilename = getenv ("GETTEXT_LOG_UNTRANSLATED");

if (logfilename != NULL && logfilename[0] != '')
    _nl_log_untranslated (logfilename, domainname, msgid1, msgid2, plural);
This code logs untranslated messages to a file specified by an environment variable. To verify that this code is executed, I tried setting the environment variable to something and, indeed, this created a giant log file with 38457 untranslated messages.
Measuring getenv performance
I believe this is the only place where getenv is called, therefore it must have been called exactly 38457 times. Dividing the 1356 ms reported by WPA by 38457 results in an average execution time of 35 µs per call.
I am not very confident in this calculation, because I have not checked that this is indeed the correct number of calls and the timings come from the sampling profiler, which is not perfectly accurate. But if this is correct, it seems awfully slow to me, considering what getenv does.
To verify this, I measured the speed of getenv with a micro-benchmark:
#include <iostream>
#include <cstdlib>

int main() {
    unsigned int result = 0;
    for (int i = 0; i < 10000000; i++) {
        const char* env = std::getenv("GETTEXT_LOG_UNTRANSLATED");
        if (env) result += *env;
    }
    std::cout << "Result: " << result << std::endl;
}
Compiled in MinGW using g++ -O2 test.cpp and measured in PowerShell:
PS S:DataProgrammingCpptest> Measure-Command { .a.exe }

[...]
TotalSeconds      : 23.5420313
TotalMilliseconds : 23542.0313

PS S:DataProgrammingCpptest> $Env:GETTEXT_LOG_UNTRANSLATED = "a"
PS S:DataProgrammingCpptest> Measure-Command { .a.exe }

[...]
TotalSeconds      : 3.9114924
TotalMilliseconds : 3911.4924

PS S:DataProgrammingCpptest> .a.exe
Result: 970000000
Compared to Ubuntu running in the Windows Subsystem for Linux (WSL):
green@SHREDDER:/mnt/s/Data/Programming/Cpp/test$ g++ -O2 test.cpp
green@SHREDDER:/mnt/s/Data/Programming/Cpp/test$ time ./a.out
Result: 0

real    0m0.151s
user    0m0.141s
sys     0m0.016s
green@SHREDDER:/mnt/s/Data/Programming/Cpp/test$ export GETTEXT_LOG_UNTRANSLATED=a
green@SHREDDER:/mnt/s/Data/Programming/Cpp/test$ time ./a.out
Result: 970000000

real    0m0.161s
user    0m0.156s
sys     0m0.000s
For reference, my environment contains 65 variables on Windows and 20 in WSL (according to set / env).
Oddly, the code is a lot faster on Windows if the environment variable is defined. In the usual case, where the variable is not defined, the average execution time is about 2.35 µs per call, so the back-of-the-envelope calculation seems to be off by about an order of magnitude.
In conclusion, this is a significant performance difference between Windows and Linux. However, at 2.35 µs per call getenv should only use about 90 ms of CPU time total, instead of the 1356 ms reported by the profiler.
Note, that even with fast sampling, the sampling interval is 122 µs, which is much larger than the ~2 µs measured here. Accordingly, I do not really trust the data from the sampling profiler. To measure the performance of getenv during Inkscape startup, an instrumenting or range-based profiler would be much better suited, but I do not think this is necessary here.
Updating the color palettes
Stepping back for a second, the initial finding was that translating color names appears to be slow, so let’s have a closer look at the color palettes.
Inkscape ships with 24 default palettes containing a total of 8554 colors (that’s a lot of nuts colors). Interestingly, 7723 of them just use the color value in hexadecimal notation as the name, which does not make much sense to translate. But some of the remaining 831 colors do seem to be translated (e.g. 199 are translated to German).
However, I noticed that _loadPaletteFile already has fallback code that formats the color value in hexadecimal if the name is empty! Can the startup time be improved – without even changing a single line of code – by just deleting the redundant names from the default palette files?
The startup time seems to fluctuate quite a bit. Therefore I wrote a little program that repeatedly launches an application and measures the time between starting the process and the window being shown.
In the graph below you can see a comparison of the startup time between an unmodified Inkscape 1.1 installation and one where I deleted hexadecimal names from the default palettes.

That is a clear success!
As you can see, the first few iterations are rather unpredictable, even though I tested both installations before, so the first iteration is already a hot start. I will show all iterations in the graphs, but ignore the first two for statistical analysis.
With that said, this change causes a reduction in startup time from 3.39 seconds to 3.08 seconds. This is a respectable 9% improvement without even touching the code! A small disclaimer is that these startup times are very low, since they were very hot starts on an otherwise idle machine. Anyway, I have opened a pull request for this change on the Inkscape repository.
New format code
Since the fallback code is now used for most of the colors, I tried to replace the original formatting code with this probably more efficient version:
static Glib::ustring formatColorHexName(unsigned int r, unsigned int g, unsigned int b) {
    if (r >= 256) r = 0;
    if (g >= 256) g = 0;
    if (b >= 256) b = 0;

    #define FMT_HEX(x) (((x) < 10) ? '0' + (x) : 'A' - 10 + (x))

    char buffer[8];
    buffer[0] = '#';
    buffer[1] = FMT_HEX(r / 16);
    buffer[2] = FMT_HEX(r % 16);
    buffer[3] = FMT_HEX(g / 16);
    buffer[4] = FMT_HEX(g % 16);
    buffer[5] = FMT_HEX(b / 16);
    buffer[6] = FMT_HEX(b % 16);
    buffer[7] = 0;

    #undef FMT_HEX

    return Glib::ustring(buffer, 7);
}

...

    if (name == "") {
        name = formatColorHexName(r, g, b);
    }
However, the average startup times were 3.17 s and 3.15 s, so this change did not have a significant effect. (Note, that I made custom builds from the master branch with and without this change, so the startup times cannot be compared with the other ones, since this is different code compiled on a different machine.)

To be found or not to be found
The palette experiment confirms that ETW correctly identified that g_dpgettext2 is slow. However, as shown by the micro-benchmark, getenv does not seem to be the main culprit and the performance is lost somewhere else.
Next, I wanted to test if it makes a difference if translations are found or not. I used the untranslated messages from the log file and compiled a translations file that just translates each message to itself. This reduces the number of untranslated messages to 2730 (I only translated messages from the Inkscape project, the remaining messages are from glib and GTK).
This had only a minimal effect on startup time, reducing the average from 3.11 to 3.05 seconds.

Conclusion
I have already spent more time on this project than initially planned, so, unfortunately, I have to stop here.
To summarize, I analyzed the startup time of Inkscape on Windows using ETW and identified translation lookup as one source of slowdown. I was able to reduce startup time by 310 ms by updating the data files without any significant changes to application behavior.
Still, further improvements could be made by making the thousands of remaining translation lookups faster. A first step would be to investigate what is actually causing it to be this slow. While I have demonstrated that getenv is ~150 times slower on Windows compared to Linux (in WSL), this explains only a small fraction of the time spent.
Unfortunately, looking up translations involves two other projects glib and gettext, making changes more difficult. Inkscape developers might want to look into reducing calls to gettext and other translation functions (many messages are looked up multiple times).
There are also many other areas that could be further investigated, e.g. the pool thread and the gdbus.exe process, although they run in parallel and do not appear to be on the critical path.
I hope this report inspires some of you to continue the investigation and help improve Inkscapes startup time.
Appendix: Setting up the development environment
These instructions were written from memory, so I might have forgotten something important. If you have any corrections, please send me an email.
Last updated: August 2021
Inkscape is developed using MSYS2. The Inkscape wiki has a detailed page on how to install everything. The only thing I changed was to activate debug builds. So, the ‘Building Inkscape with MSYS2’ section can be replaced with:
mkdir build
cd build

cmake -G Ninja -DCMAKE_BUILD_TYPE=Debug ..
ninja install
To build glib this outdated article lists some dependencies, but I do not know which ones are still necessary, because the build system has been changed to meson:
pacman --needed --noconfirm -S automake autoconf make libtool unzip glib2-devel
    intltool pcre-devel mingw-w64-x86_64-toolchain mingw-w64-x86_64-pcre
For meson I found that one has to use the mingw variant:
pacman --needed --noconfirm -S mingw-w64-meson mingw-w64-python
After that I had to restart the command prompt for the commands to be found.
Then glib can be built using (debug mode is already the default):
meson setup build
cd build
ninja
After the build was finished, I copied all relevant exes and dlls from the build directory to inkscapebuildinkscapebin.
Finally, the debug symbols seem to be included inside the binaries themselves (I assume in DWARF format), but WPA requires PDB files.
For this I used cv2pdb, which I built from source using the provided Visual Studio files, and then ran on everything inside inkscapebuildinkscapebin.
for /R %f in (*) do cv2pdb %f
To load the symbols in WPA, use Trace – Load Symbols.